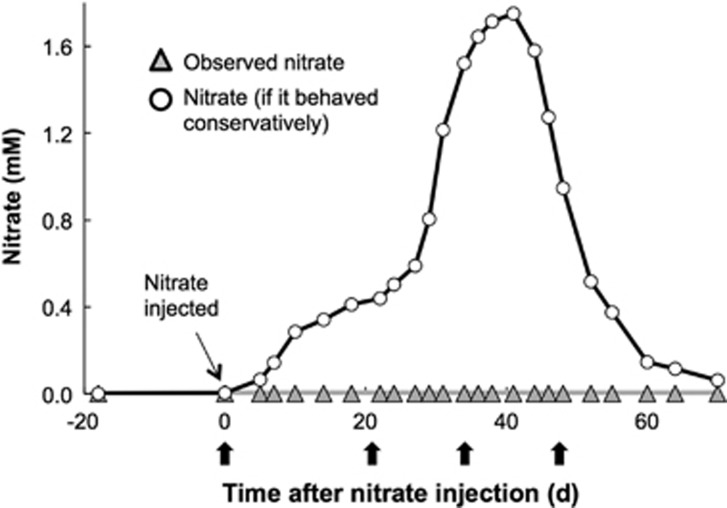
Figure 1.
Nitrate concentrations in groundwater (well CD01) collected 2.5 m downgradient of injection wells. Observed nitrate concentrations are shown along with calculated concentrations that would be expected if injected nitrate had behaved conservatively, that is, was not consumed by biological activity (see text). The black arrows represent the time of collection for metagenomic/metatranscriptomic samples.

