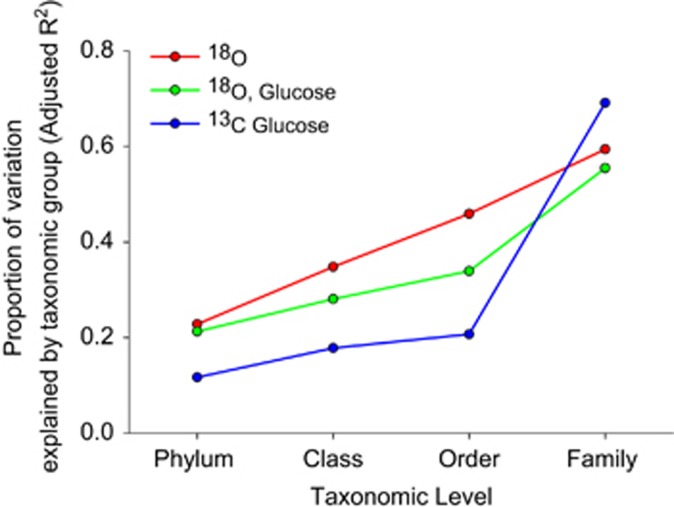
Figure 2.
Variation in excess atom fraction of 18O or 13C of each taxon's DNA after incubation with 13C-glucose (blue) or H218O in the presence (green) or absence (red) of natural abundance glucose explained by group membership at different taxonomic levels. Values reflect linear model results for groups with a minimum of five member taxa.

