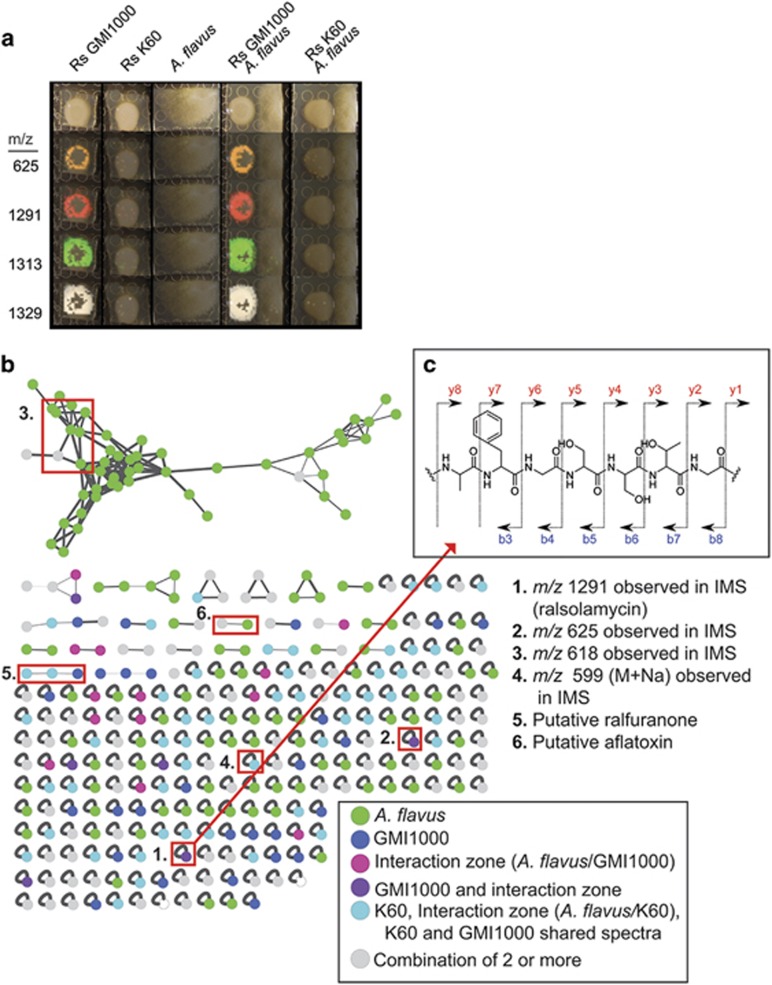
Figure 3.
Analysis of differential IMS data sets, MS-MS networks indicate a single lipopeptide produced by R. solanacearum strain GMI1000 is responsible for initiating chlamydospore formation. (a) IMS analysis of strains GMI1000 and K60 showing only differential signals from this data set. Complete data set is in Supplementary Figure S4. (b) Network analyses of microbial metabolites detected in the MS-MS studies. The network is composed of nodes representing ions associated with the microbial colonies. Nodes are connected by edges, which represent the relatedness of the fragmentation patterns of each spectrum. Nodes only associated with A. flavus colonies are green. Nodes only associated with only GMI1000 are dark blue. Nodes associated with the ‘interaction zone' are labeled in pink, Nodes found in the GMI1000 cultures and ‘interaction zone' (A. flavus/GMI1000) are labeled purple. Nodes associated with any of the K60 culture conditions or that are shared between k60 and GMI1000 are colored in light blue. Nodes common to two or more of the previous node classes are labeled in gray. Nodes of interest from the IMS study (1–4) and those that are known products of the microbes (5–6) are highlighted with red boxes and listed on the right of the figure. (c) MS/MS spectra of extracted metabolites shows a unique fragmentation pattern of G-T-S-S-G-F-A for the compound with a m/z of 1291(top right).

