Fig. 6.

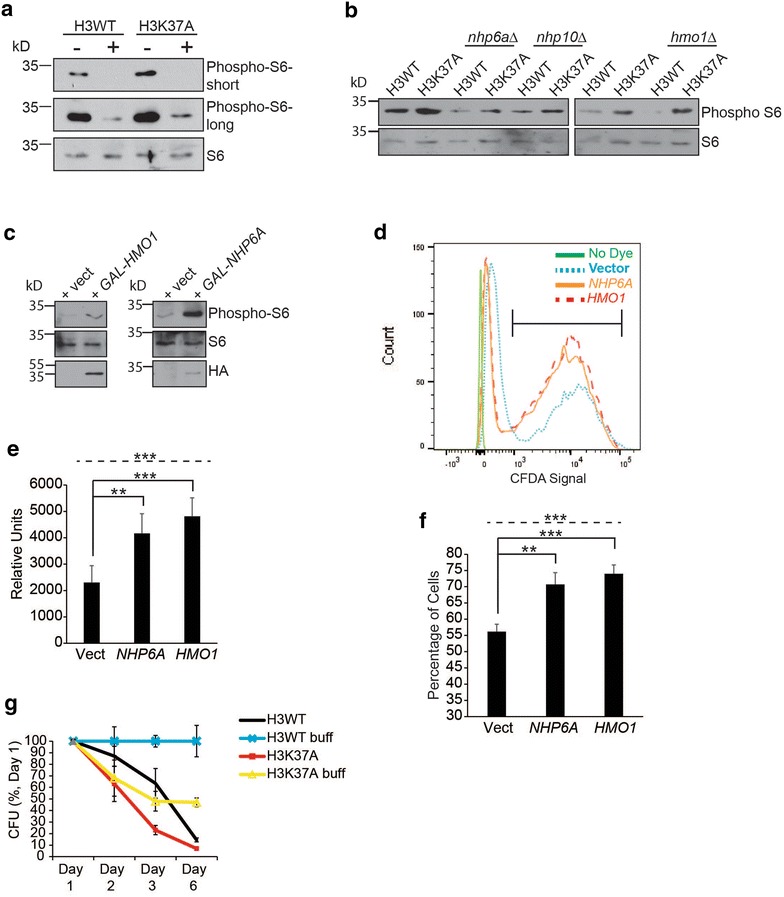
HMG chromatin binding and TORC1 function to promote cell viability and longevity. a IB analysis for phosphoS6 levels from H3WT and H3K37A cells cultured to log phase and then either mock or 20 nM rapamycin treated for 30 min. b As in a except the indicated HMG gene deletion mutants were included. c H3WT cells were transformed with control vector or the indicated galactose-regulated HMG expression vectors and cultured to log phase in raffinose media before induction with 2 % galactose for 20 min. Samples were then processed for phosphoS6 IB analysis. d–f As in c except cells were cultured solely in raffinose media to log phase and then stained with 5(6)-CFDA and analyzed by flow cytometry. e represents the average and SD of the peak 5(6)-CFDA fluorescence of the entire gated population, while f is the average cell number and SD of the fraction inside the bracket in d. Data are quantification of five independent experiments. g Chronological aging assay of H3WT and H3K37A performed in non-buffered and buffered (buff) SC media. Each strain was cultured in triplicate, and the data represent the average and SD of each time point performed in triplicate. For all statistical analyses, one-way ANOVA was performed across all categories (indicated by the dashed line), while the solid black lines indicate specific pairwise comparisons that were analyzed by Student’s t test. *P < 0.05; **P < 0.01; ***P < 005
