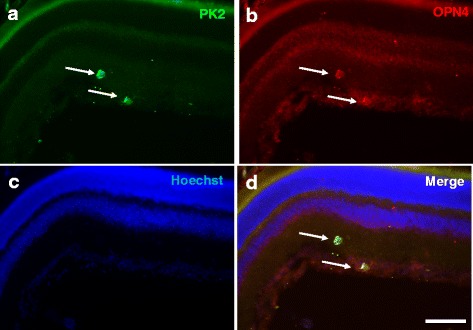
Fig. 3.

Coexpression of PK2 and OPN4 in retinal ganglion cells of the mouse retina. The PK2 immunostaining is shown as green (a) whereas the OPN4 fluorescent immunolabeling is shown in red (b). The nuclear counterstaining is shown as blue (c). Coexpression of PK2 and OPN4 in the retinal ganglion cells is apparent (d). Two cells strongly immunostained by PK2 and OPN4, indicated by arrows, are shown. Scale bar, 40 μm
