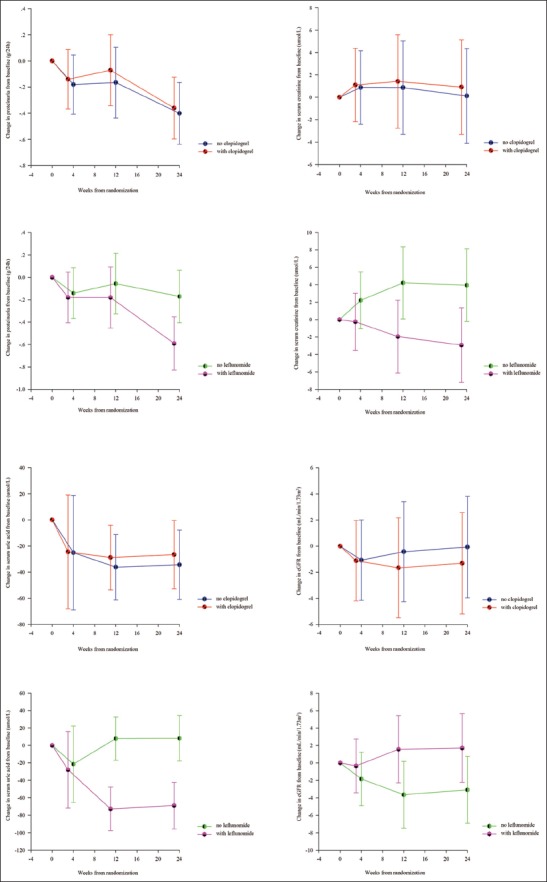
Figure 2.

Estimated mean change curves for proteinuria, serum uric acid, serum creatinine, and estimated glomerular filtration rate according to treatment group (linear mixed-effect model). Error bars represent 95% confidence intervals.

Estimated mean change curves for proteinuria, serum uric acid, serum creatinine, and estimated glomerular filtration rate according to treatment group (linear mixed-effect model). Error bars represent 95% confidence intervals.