
Figure 1.
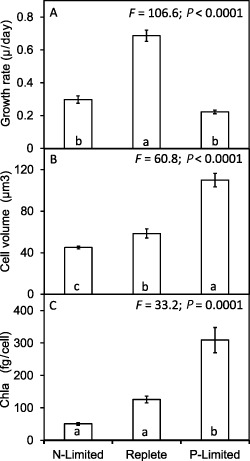
Growth rates of E miliania huxleyi 1516 and changes in cellular biovolume and Chl a content in response to N and P limitation. Significant differences are shown by analysis of variance and Tukey honestly significant difference tests (different letters a, b, c indicate significant differences at 0.05 confidence level).