
Figure 2.
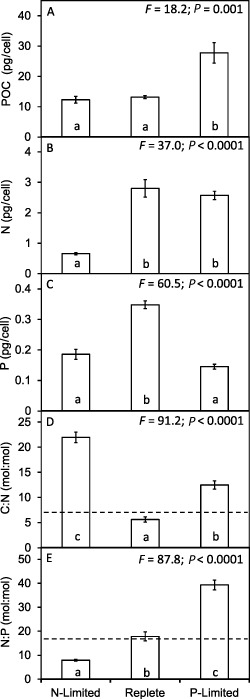
Changes in cellular POC, N and P content of E miliania huxleyi 1516 and shifts in molar stoichiometry of POC : N : P in response to N and P limitation. Significant differences are shown by analysis of variance and Tukey honestly significant difference tests (different letters a, b, c indicate significant differences at 0.05 confidence level). Dotted lines on D and E represent Redfield ratio stoichiometry.