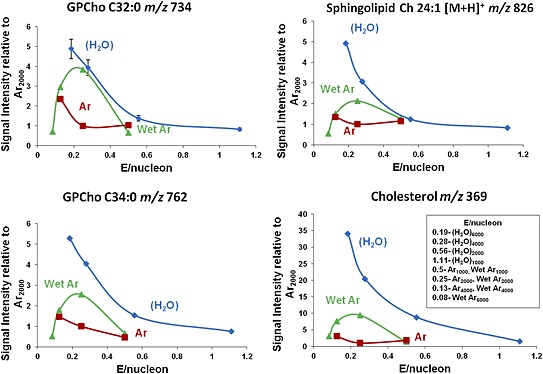
Figure 3.

Comparison of the ion signals from mouse brain extract relative to those observed from Ar2000 using water (H2O)n – blue; argon Arn – red; and water‐doped argon (H2O)Arn – green; cluster beams as a function of E/nucleon at 20 keV for the [M+H]+ ions from the phospholipids GPCho C32:0 at m/z 734; GPCho C34:0 at m/z 762; sphingolipid Ch 24:1 at m/z 826; and the cholesterol [M+H–H2O]+ ion at m/z 369.
