
Figure 1.
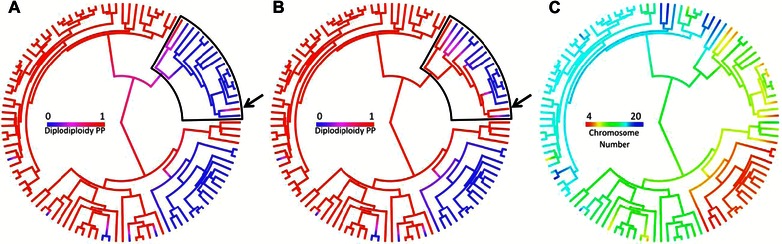
Ancestral state reconstructions. (A) Posterior probability of diplodiploidy under a model in which transition from haplodiploidy (blue) to diploidy (red) is allowed. (B) Posterior probability of diplodiploidy under a model in which transition from haplodiploidy to diplodiploidy is not possible. Black boxes in (A) and (B) indicate the portion of the tree in which reconstructions differ between models. (C) Maximum‐likelihood reconstruction of diploid chromosome number. The arrow in (A) and (B) indicates the family Parasitidae that was removed for one analysis.