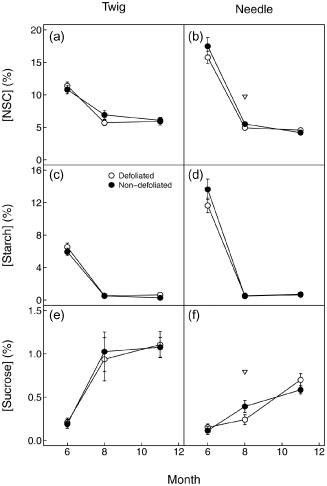
Figure 4.

Seasonal changes in total non‐structural carbohydrates (a and b) and its components: starch (c and d) and sucrose (e and f) in defoliated (white) and non‐defoliated (black) Scots pine twigs (a, c and e) and needles (b, d and f). Samples taken at predawn and midday are pooled together, and consequently each point represents the average value for a tree type at one date (n = 14–16). Error bars indicate ±1 SE. Open triangles (∇) indicate marginal significant differences (P ≤ 0.1) between defoliated and non‐defoliated trees.
