
Figure 3.
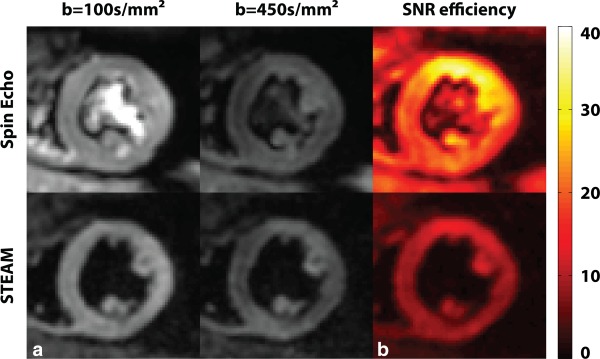
In vivo data. a: Example dataset acquired at b = 100 s/mm2 and 450 s/mm2. b: Corresponding SNR efficiency maps for b = 450 s/mm2.
Official websites use .gov
A
.gov website belongs to an official
government organization in the United States.
Secure .gov websites use HTTPS
A lock (
) or https:// means you've safely
connected to the .gov website. Share sensitive
information only on official, secure websites.
In vivo data. a: Example dataset acquired at b = 100 s/mm2 and 450 s/mm2. b: Corresponding SNR efficiency maps for b = 450 s/mm2.