
Fig. 2.
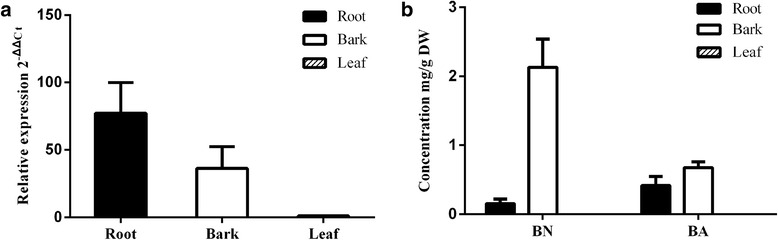
The accumulation pattern of the BPLO transcripts and its enzymatic products in B. platyphylla tissues. a the BPLO transcripts measured by qRT-PCRs; b the BPLO enzymatic products (BN and BA) measured by GC-MS analysis. BN, betulin; BA, betulinic acid. Error bars represent the standard errors (SE) of the means calculated from three biological replicates