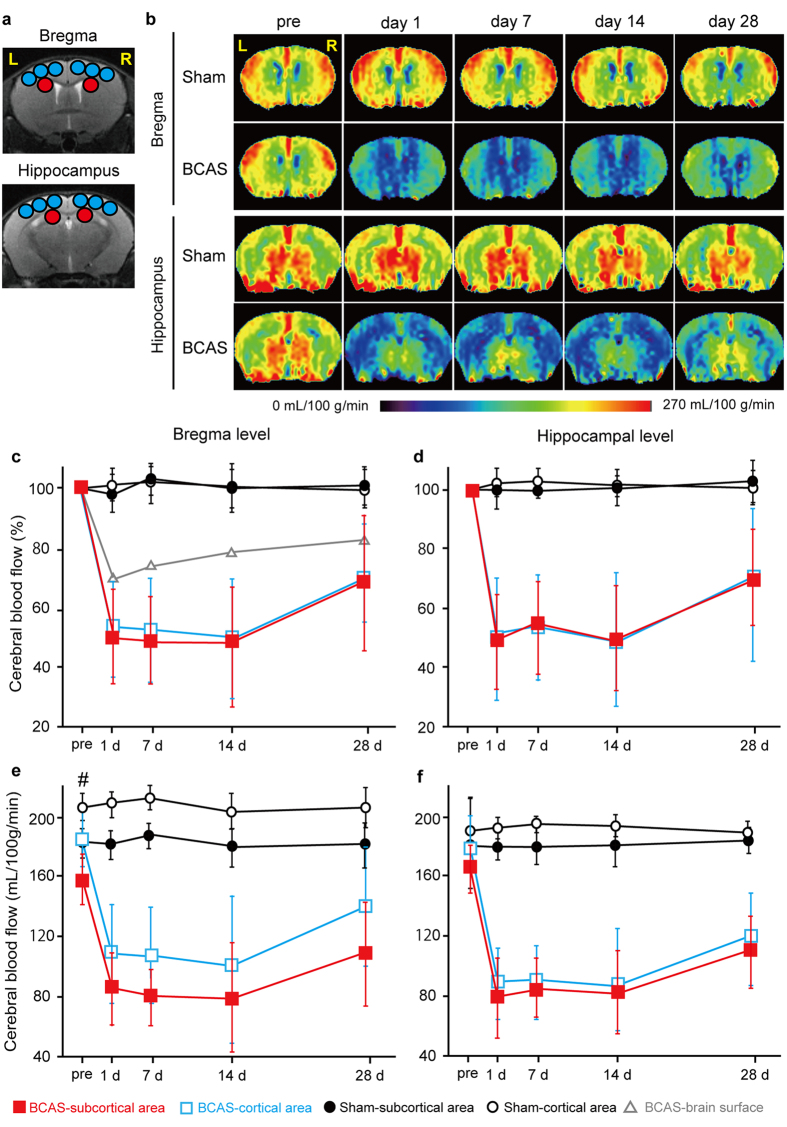
Figure 2. Temporal profiles of cerebral blood flow (CBF) of BCAS mice.
(a) Regions of interest (ROIs) used in the analyses of cerebral blood flow (CBF) images obtained from arterial spin labeling (ASL) magnetic resonance perfusion imaging. The CBF values in cerebral cortex were calculated from the six blue ROIs, and red circles indicate ROIs of the subcortical area. (b) Representative multi-slice coronal CBF images obtained from ASL at the bregma and hippocampal levels. (c,d) Temporal profiles of CBF values which are presented as a percentage of the preoperative value in the cortical (open blue square) and subcortical (filled red square) parenchymal area of BCAS mice (n = 8), and in the cortical (black open circle) and subcortical (black filled circle) parenchymal area of sham-surgery mice (n = 5) at the bregma (c) and hippocampal level (d). For comparison, brain surface CBF profile (open gray triangle) at the bregma level before and after BCAS, assessed with laser speckle flowmetry in a previous report9, is superimposed (c). (e,f) Temporal profiles of CBF presented using absolute values (mL/100 g/min) in the cortical (open blue square) and subcortical (filled red square) parenchymal area of BCAS mice (n = 8) and in the cortical (black open circle) and subcortical (black filled circle) parenchymal area of sham-surgery mice (n = 5) at the bregma (e) and hippocampal level (f). Two-way repeated measures ANOVA indicates that there are significant differences in CBF values between BCAS vs. sham-surgery group in the cortical or subcortical area (p < 0.01) at the bregma and hippocampal levels (c‒f), and between cortical vs. subcortical area at the bregma level (p < 0.05; e). Unpaired t test indicates that there are significant differences between subcortical vs. cortical area pre-BCAS (#p < 0.05; e).

