Fig. 5.

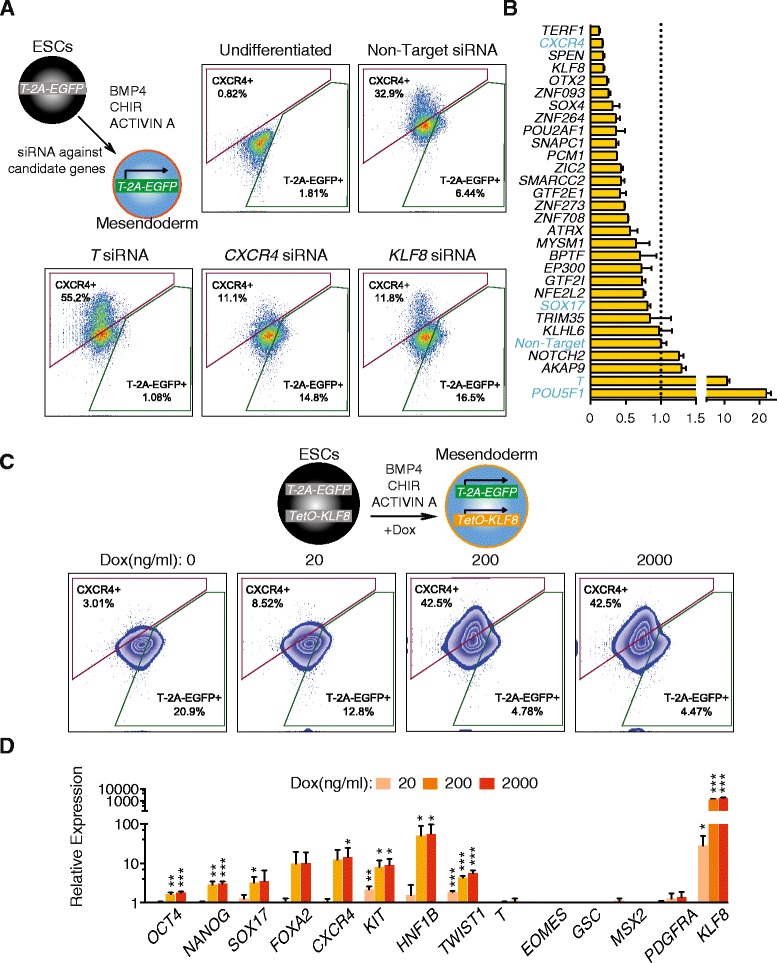
KLF8 mediates mesendoderm to DE differentiation. a Schematics of siRNA knockdown strategy. FACS analysis of CXCR4 and T-2A-EGFP expression at day two of differentiation with representative gene-specific siRNA transfection results. b Summary Differentiation Scores of siRNA knockdown experiments of the top 25 genes tested. The dashed line indicates a Differentiation Score of 1, set by the non-target siRNA control. Genes in blue font indicate control experiments. c Upper panel, schematics of KLF8 overexpression strategy during differentiation. Lower panel, FACS analysis shows CXCR4 and T-2A-EGFP expression at day two of differentiation. DOX Doxycycline. d QPCR analysis of three independent KLF8 overexpression clones tested at day two of differentiation. All data are shown as mean ± S.D. ***p <0.001; **p <0.01; *p <0.05, all by one-tailed t-test. In all FACS plots, the x-axis indicates GFP/FITC channel, the y-axis indicates APC channel
