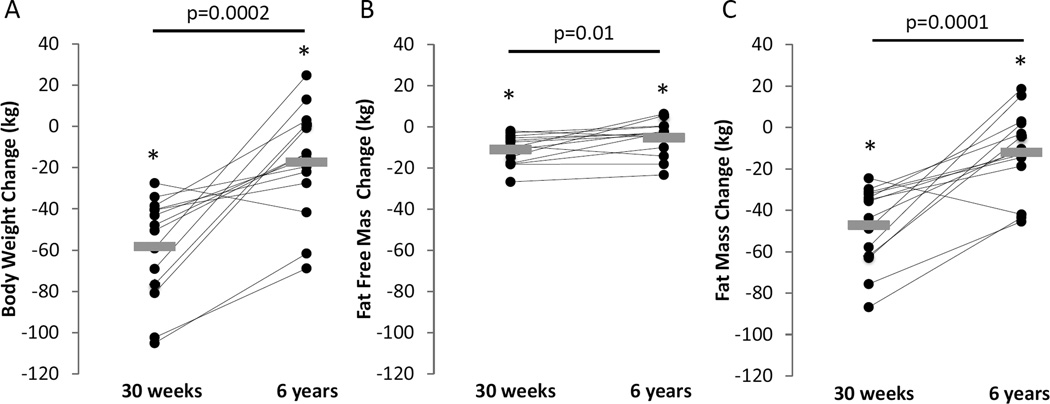
Figure 2.
Individual (●) and mean (gray rectangles) changes in body weight (A), fat-free mass (B), and fat mass (C) at the end of the 30 week Biggest Loser weight loss competition and after 6 years. Horizontal bars and corresponding p values indicate comparisons between 30 weeks and 6 years. * indicates p<0.05 compared to baseline.

