
Fig. 5.
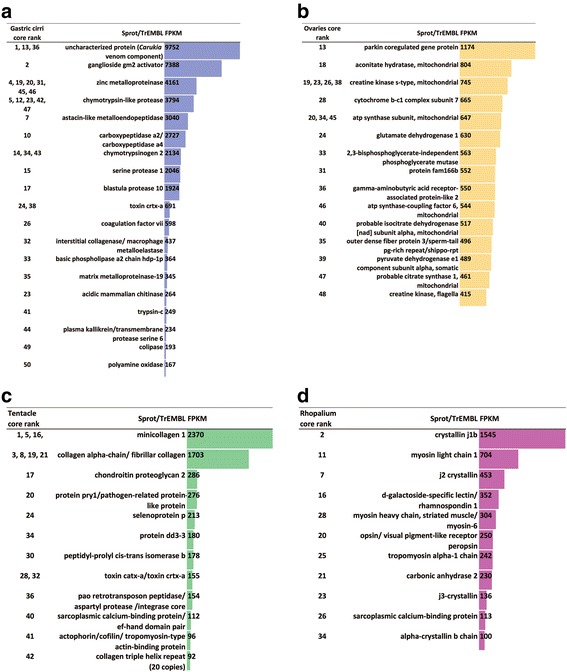
a-d Abundances of annotated “core genes” in the A. alata transcriptome according to medusa sample. Column headings correspond to rank(s) among the top 50 of each core gene (or gene family) by sample according to the Venn diagram in Fig. 4b, protein annotation from UniProtKB SwissProt (Sprot) and TrEMBL (separated by a back slash) and fpkm values in a gastric cirri, b ovaries, c tentacle (and pedalium base), d rhopalium. Genes with putative functions in sperm motility are indicated with asterisks (*) in b. Genes lacking Trinotate annotations are not included. Detailed statistics (fpkm, counts, DE values for top 50 ranked genes by sample with annotations) provided in Additional file 6)