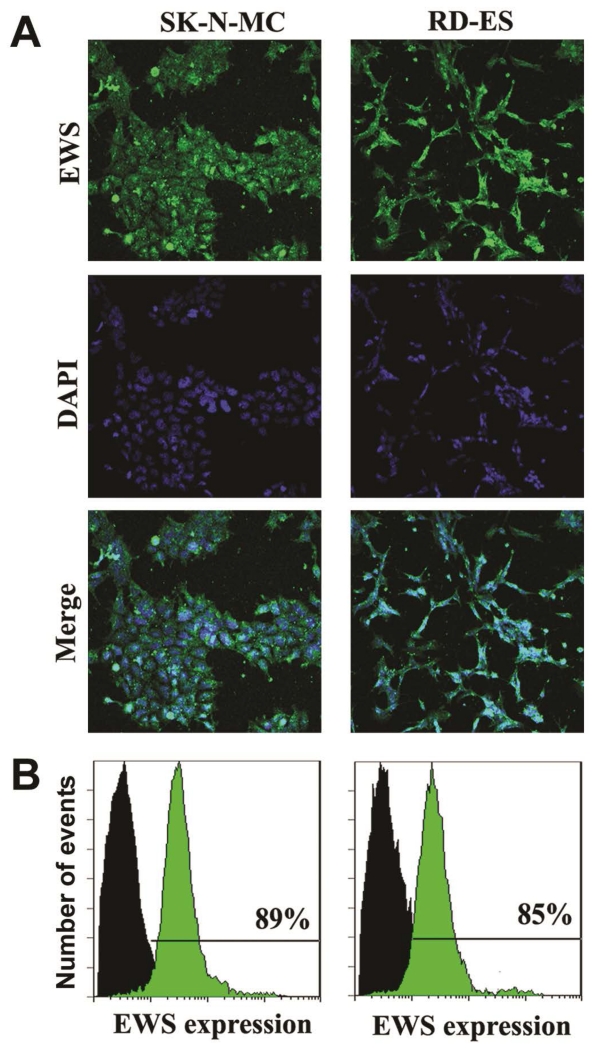
Figure 1.
Detection and determination of expression of EWS in human Ewing’s sarcoma SK-N-MC and RD-ES cell lines. (A) Representative in situ immunofluorescence staining to show the expression of EWS (FITC, green) and nuclei (DAPI, blue) in the cells. (B) Immunofluorescence staining of the cells followed by flow cytometry to determine the levels of expression of EWS (FITC, green) when compared with the control cells (without staining, black).

