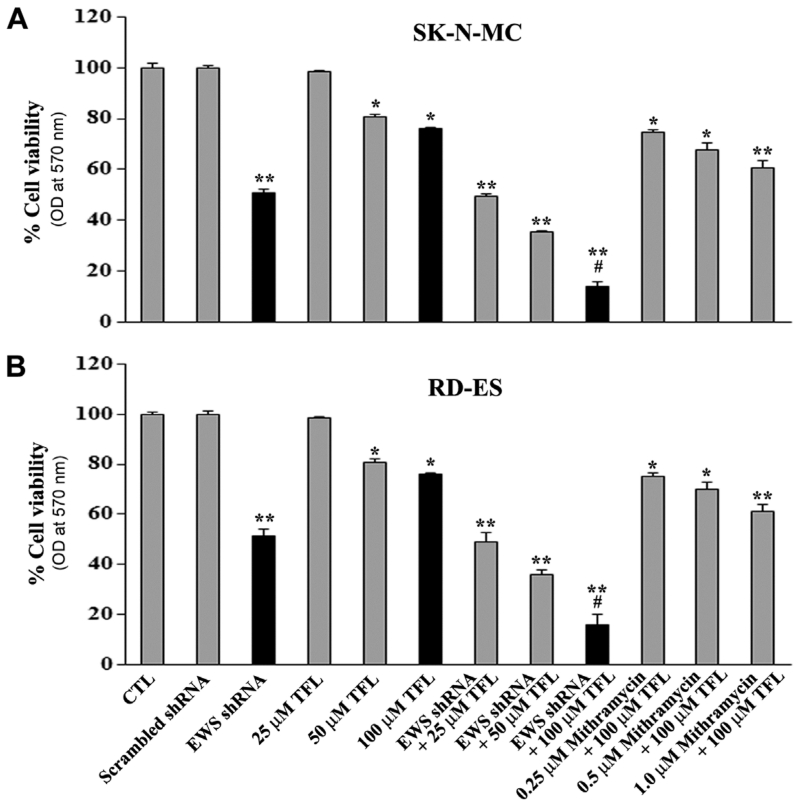
Figure 2.
Determination of residual cell viability. Amounts of residual cell viability of Ewing’s sarcoma (A) SK-N-MC cells and (B) RD-ES cells subjected to no treatment control (CTL), scrambled shRNA plasmid (0.5 μg/ml) transfection for 72 h, EWS shRNA plasmid (0.5 μg/ml) transfection for 72 h, TFL (25, 50, or 100 μM) treatment for 24 h, EWS shRNA palsmid transfection for 48 h + TFL treatment for last 24 h, and EWS shRNA plasmid transfection for 48 h + mithramycin (0.25, 0.5, or 1.0 μM) treatment for last 24 h. Mean values (n = 3) were shown and significant difference between two values was indicated by *P < 0.05 or **P < 0.01 (where monotherapy was compared with CTL) and #P < 0.01 (where combination therapy was compared with monotherapy).

