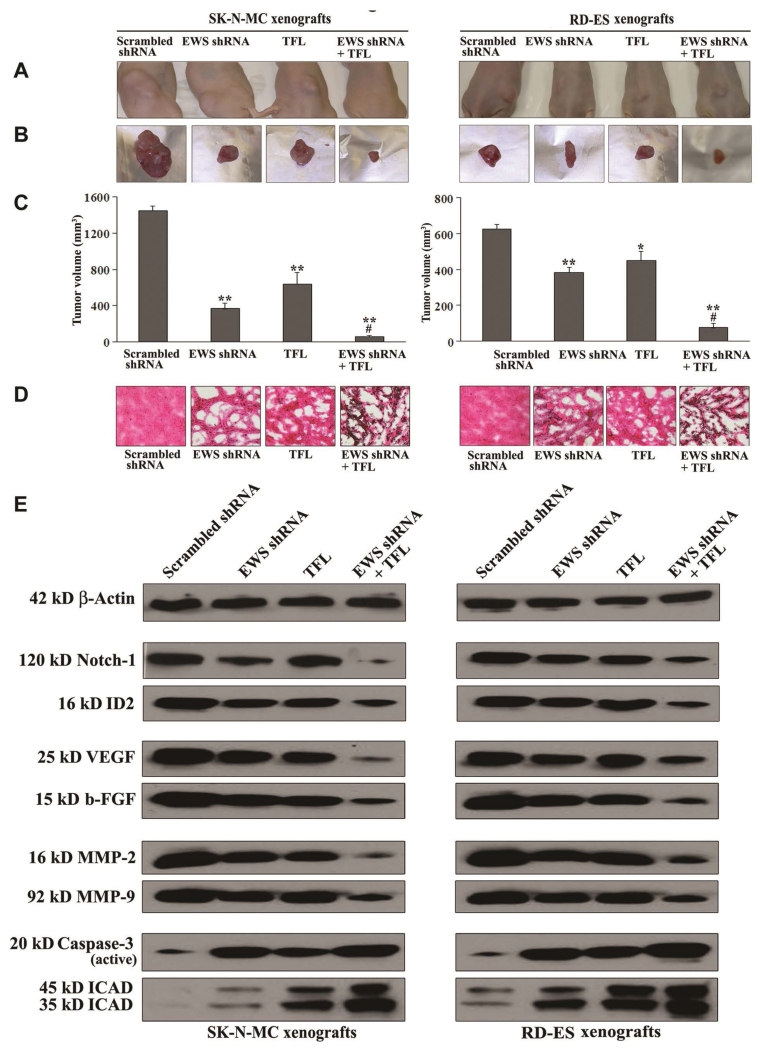
Figure 8.
Regression of human Ewing’s sarcoma SK-N-MC and RD-ES xenografts with modulation of expression of various molecules. Mice with xenografts were treated for 2 weeks. Treatments on alternate days: plasmid vector carrying scrambled shRNA cDNA (50 μg DNA/injection/mouse), plasmid vector carrying EWS shRNA cDNA (50 μg DNA/injection/mouse), TFL (20 μg/injection/mouse), and plasmid vector carrying EWS shRNA cDNA (50 μg DNA/injection/mouse) plus TFL (20 μg/injection/mouse). We used 6 animals per group. Significant difference between two values was indicated by *P < 0.05 or **P < 0.01 (where monotherapy or combination therapy was compared with scrambled shRNA) and #P < 0.01 (where combination therapy was compared with monotherapy). (A) Mice with SK-N-MC and RD-ES xenografts; (B) Representative tumors; (C) Tumor volume; (D) histopathological changes; and (E) Western blotting to examine modulation of expression of molecules involved in induction of differentiation (Notch-1 and ID2), angiogenesis (VEGF and b-FGF), invasion (MMP-2 and MMP-9), and apoptosis (caspase-3 and ICAD) after the treatments.

