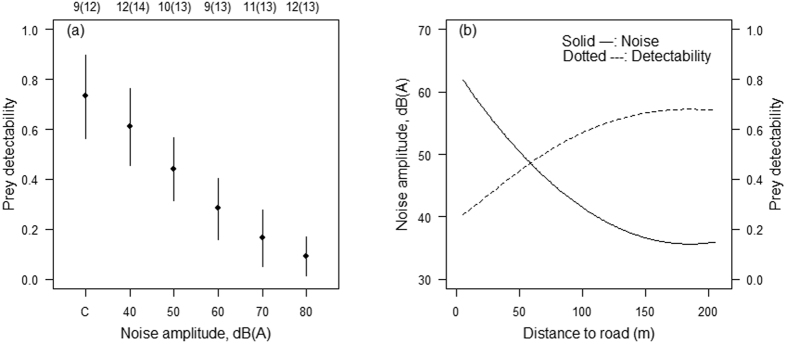
Figure 3.
(a) Estimated owls’ ability to detect prey under noise exposure levels (with 95% CI). “C” indicates control experiments. Detectability at C is estimated using average background sound level (32 dB). Top figures indicate number of experiments (number of owls analyzed). (b) Relationships between road distances and noise levels and owls’ prey detectability. The owls’ ability to detect prey was estimated based on linear regression equation presented in (a).

