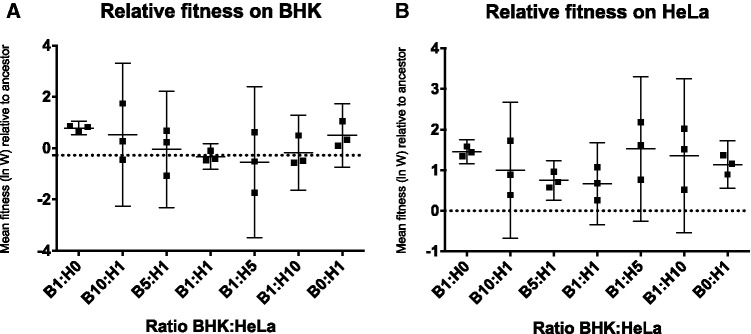
Figure 2.
Relative fitness (ln(W)) of evolved virus populations. Each point represents the fitness of an evolved population relative to the common competitor virus (mean of three trials). The grand mean (solid line) and 95 per cent CI are shown for each treatment. The dotted line represents the fitness of the ancestral virus relative to the common competitor. (A) Relative fitness on BHK cells. (B) Relative fitness on HeLa cells.

