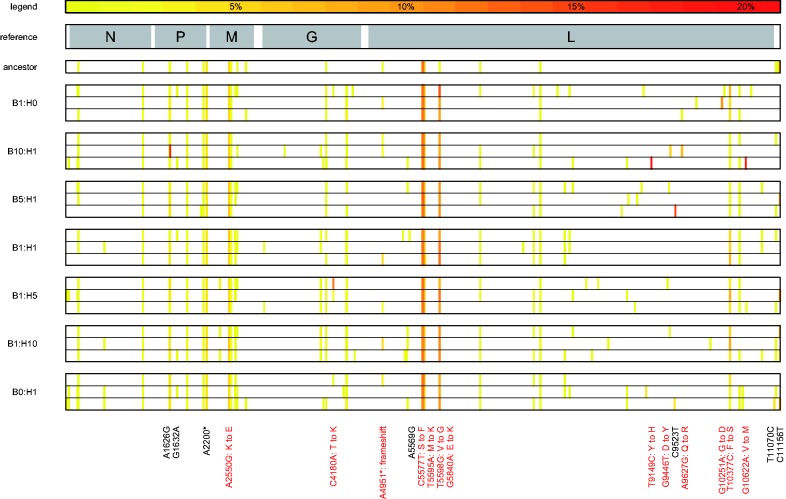
Figure 3.
Map of polymorphic loci. Polymorphic sites for which a minority allele was detected at a frequency of 1 per cent or greater are shown mapped onto the VSV genome. Allele frequency is determined as the mean of two technical replicates, and only sites with depth of coverage >30 were considered for this analysis. Each row represents one virus population, with the experimental treatment (ratio of BHK to HeLa cells) shown on the left. A reference map of the VSV genome is displayed above, with gene coding regions shaded, with overlaid gene labels. The frequency of minority alleles in each population is coded by color (see legend). The location of minority alleles that appear in any population >5 per cent are labeled below. Nonsynonymous changes are labeled in red, and the amino acid substitution is listed.

