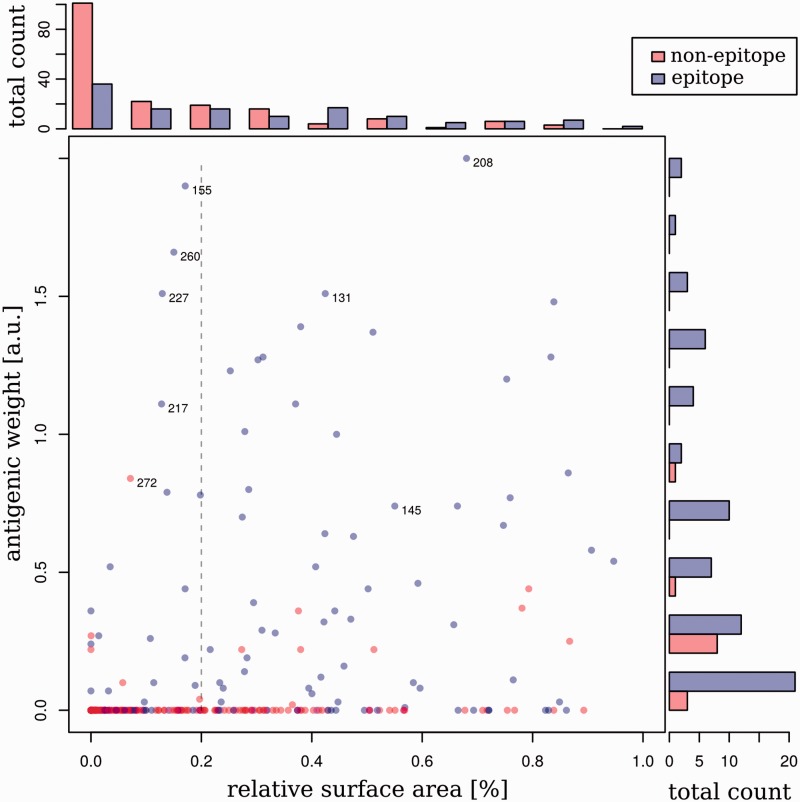
Figure 2.
Distribution of antigenicity-altering effects. Antigenic weights are plotted versus the relative available surface area (RSA) for residues within the epitope regions (blue) and outside the epitope regions (red) on HA of human influenza A/H3N2 viruses. Residues with an RSA of more than 5 per cent lie to the right of the dashed gray line. On the side of the plot are histograms showing the number of sites with particular antigenic weights (right) or RSA values (top). Note that the histogram on the right-hand side of this figure compares only the antigenic weights between non-epitopes and epitope sites, whereas the histogram at the top of this figure shows the comparison of RSAs between non-epitope and epitope residues.

