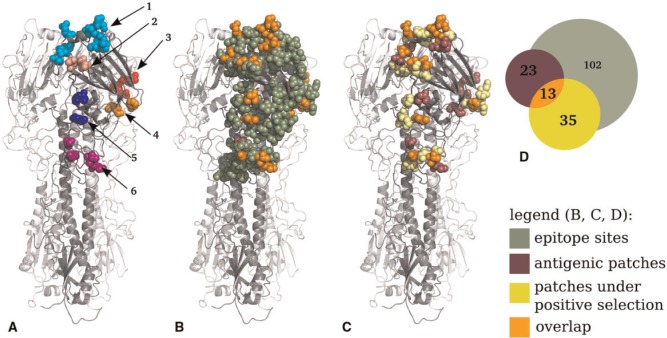
Figure 3.
Location of the inferred antigenic patches on influenza A/H3N2 HA. (A) Antigenic patches on the HA homotrimer, numbered according to Table 1. (B) Location of epitope sites (dark green), antigenic patch sites (purple), and sites included in both sets (orange). Note that only residue 272 is not included in the overlap. (C) Comparison of antigenic patch sites (purple) to patches of sites under positive selection (Tusche, Steinbrück, and McHardy 2012) (yellow) and to sites included in both sets (orange). (D) Venn diagram showing the overlap of antigenic patches, patches under selection, and epitope sites (Supplementary Fig. S1). Note that there is no coherence between circle size and site counts.

