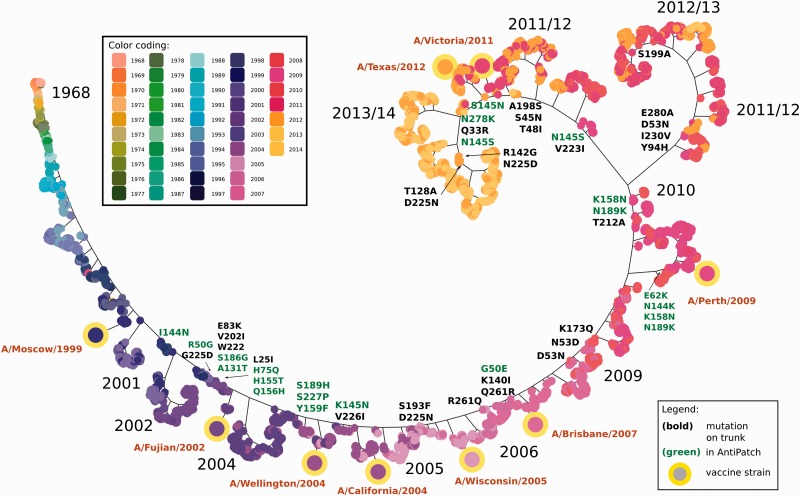
Figure 4.
Phylogeny showing the genetic evolution of influenza A HA sequences of subtype H3 since 1968. A single trunk line (and a major branch around 2011) shows the evolution of HA since 1968. Amino acid changes occurring on the trunk and the major branch line are indicated for the subtree containing strains that occurred after 2002. Changes on patch sites are colored in green. Note that branches are scaled for visualization purposes only and do not represent molecular distances. Leaf nodes in the phylogenetic tree are colored based on the year in which the corresponding virus was isolated.

