
Figure 1.
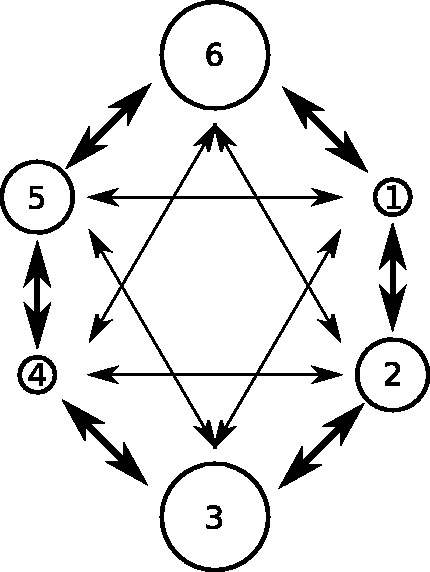
Depiction of the population structure used in structured coalescent simulations. Circles represent demes; two are small, two medium, and two large. Thick arrows represent fast rates of movement between demes (0.05 transitions per lineage per year) and thin arrows slower rates (0.025 per lineage per year).