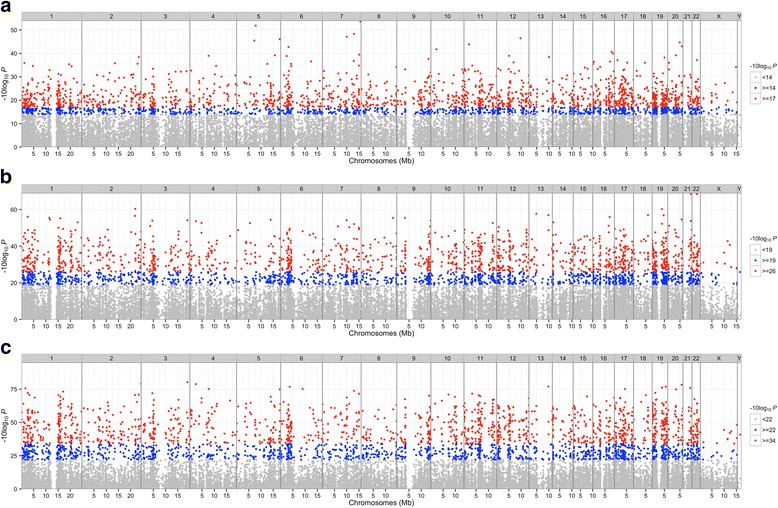
Fig. 2.

Manhattan plot of significant CpG markers. a, b and c belong to KD1 vs. FC, KD3 vs. FC and KD3 vs. KD1 comparisons, respectively. The ‘P’ in X axis denotes the p value of ANOVA analysis. Figure 2 shows that fewer CpG markers altered in KD1 vs. FC comparison than other two ones. The Manhattan plots were generated with R package ‘qqman’
