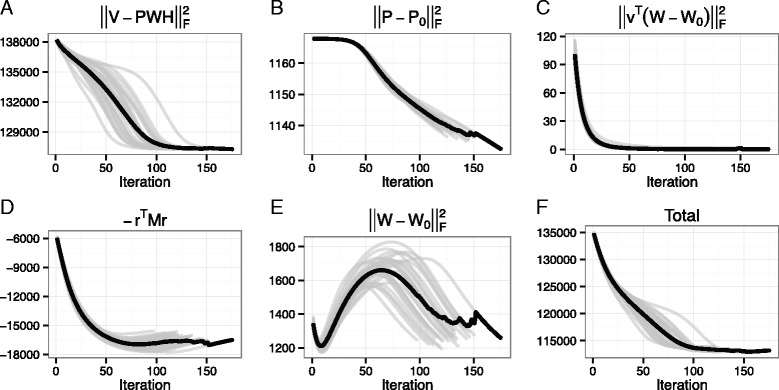
Fig. 2.

Convergence curve of NMTF optimization procedures. a The squared error, b the mutation pathogenicity constraint, c and e the disease gene constraint, d the gene-gene interaction constraint, and f the total values of objective function are denoted on the y-axis. The x-axis denotes the iteration number. The black line represents the averaged line over the best-30 optimization results encoded as grey lines
