
Fig. 2.
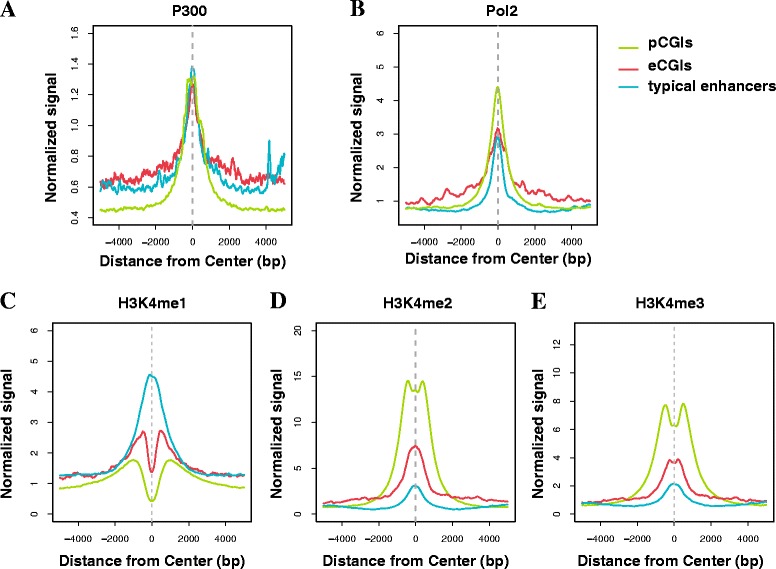
Epigenetic marks reveal that the eCGIs have enhancer signatures. Distribution of epigenetic marks spanning 5 kb from the center of the eCGIs, typical enhancers, and pCGIs, respectively. P300 and Pol2 are closely related to enhancer activity a, b and H3K4 methylations are known as enhancer c, d or promoter e markers