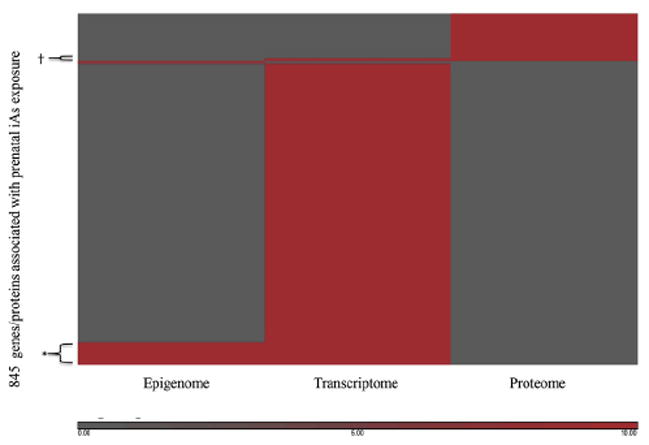
Figure 1.

The heatmap depicts genes (N = 845) identified as changed in relationship to prenatal iAs in studies focusing on the epigenome (CpG methylation), the transcriptome (gene expression), and the proteome (protein expression) representing 12 studies. Red shading indicates that the gene was significantly associated with prenatal iAs exposure. Gray shading indicates that the gene was not significantly associated with prenatal iAs exposure. *The 54 genes that had altered levels of gene expression as well as altered levels of CpG methylation in relation to prenatal iAs exposure. †The 7 genes that had altered gene expression levels as well as protein expression levels.
