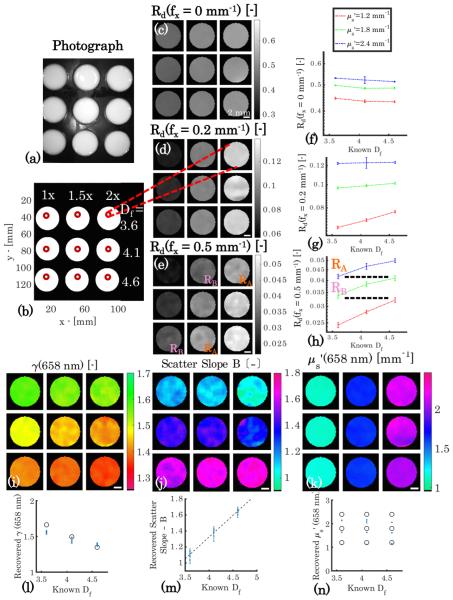
Fig. 4.
Phantoms with coupled and γ variation. (a) Photograph, (b) annotation of and Df values. Panels (c)–(e) show reflectance images at λ = 658 nm and f x = [0; 0.2; 0.5] mm−1 , while panels (f )–(h) show absolute values of reflectance versus Df at each level of for each spatial frequency. The dashed lines in (h) correspond to areas within (e) and highlight the non-uniqueness of the reflectance intensity with respect to combinations of and γ. Panels (i),(j), and (k) show recovered γ(658 nm), scatter slope B, and (658 nm) maps. Below are corresponding plots of recovered optical property values versus Df in (l), (m), and (n), where the blue error bars represent recovered mean values ± one standard deviation, the black circles represent the Mie theory predicted γ(658 nm) and (658 nm) values, and the black dotted line represents a regression of scatter slope B versus Df (r = 0.983). Scale bar is 2 mm.

