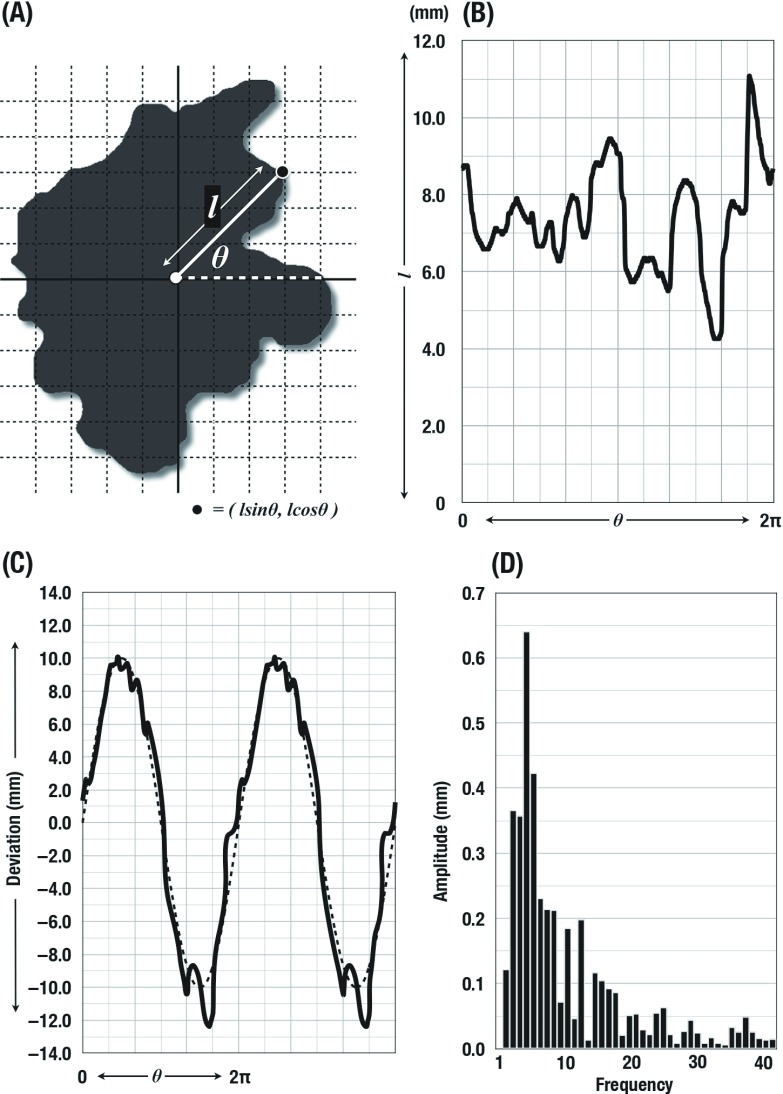
Fig. 1.
Fast Fourier transform (FFT) analysis for the contour of tumor. Initially the outline of each tumor on chest computed tomography images was described using polar coordinates (A). Then the data were converted to rectangular coordinates (B). The wave data were combined to the reference standard sine curve and repeated data were constructed (C). Harmonics at the frequency of 2 to 359 times per cycle were calculated in each tumor using FFT analysis. In this figure, only initial 40 harmonics were presented (D).

