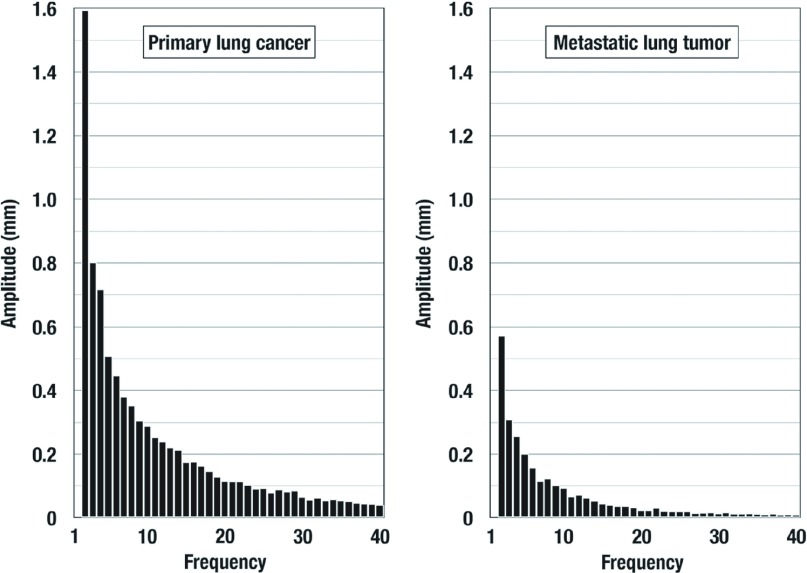
Fig. 2.
The average amplitudes of each harmonics in Groups primary lung cancer (PL) and metastatic lung tumor (MT). The amplitude was gradually decreased in both two groups as the frequency increased. In this figure, only initial 40 harmonics were presented in each group. The amplitude was higher in Group PL than Group MT in all 358 harmonics (P <0.0001).

