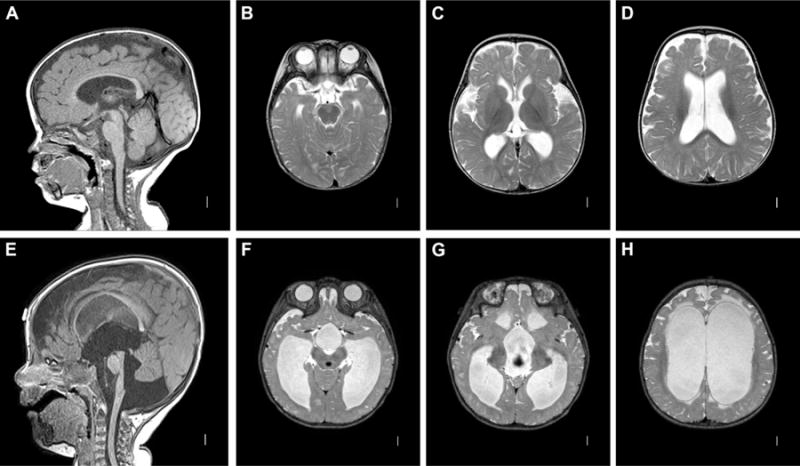
Figure 5. Communicating hydrocephalus. A–D: mild idiopathic communicating hydrocephalus.

Sagittal T1 MRI image (AS) showing open aqueduct and absence of posterior fossa crowding. Axial T2 images (B–D) showing rounded, mildly dilated ventricles with generous extraaxial space. E–H: severe idiopathic communicating hydrocephalus. Sagittal T1 image (E) showing enlarged aqueduct, 4th ventricle, and excess fluid within the posterior fossa. Axial T2 images (E–H) demonstrate marked ventriculomegaly with transependymal flow.
