Fig. 2.
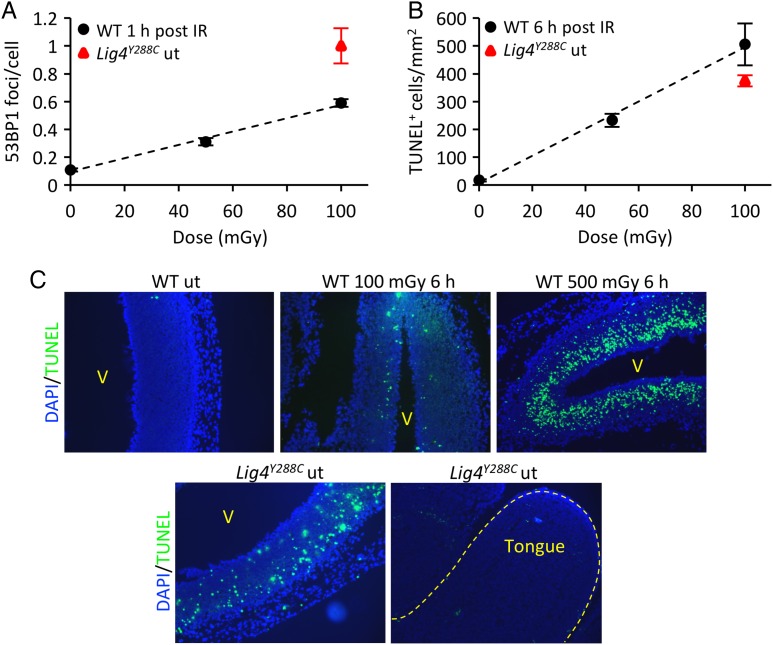
Endogenous and IR-induced DNA damage and apoptosis in the embryonic neocortex. (A) 53BP1 foci dose response in E13.5 WT embryos 1 h after exposure to 50–100 mGy X-rays (black circles). Endogenous level of 53BP1 foci in E14.5 Lig4Y288C embryos (red triangle). (B) Dose-dependent increase in apoptosis in the neocortex of E13.5 WT embryos 6 h after exposure to 50–100 mGy X-rays (black circles). Endogenous level of apoptosis in E14.5 Lig4Y288C embryos (red triangle) [16, 22]. (C) Representative sagittal sections of E14.5 embryonic forebrains showing the level of apoptosis (TUNEL staining, green) in the WT neocortex after 100 and 500 mGy X-rays. Increased endogenous apoptosis is observed in the Lig4Y228C untreated neocortex; in contrast, other embryonic tissues (e.g. tongue) show very little or no endogenous apoptosis. Note that the analysis for WT embryos was carried out at E13.5, whereas for Lig4Y288C, E14.5 embryos were used. For 53BP1 foci analysis, the foci numbers are more efficiently enumerated at E14.5, where the IZ occupies a greater part of the forebrain [22]. 53BP1 foci numbers at E14.5 are still slightly elevated in Lig4Y288C embryos compared with WT E14.5 embryos exposed to 100 mGy [21]. For apoptosis, the level is substantially greater at E13.5 compared with E14.5 [22]. Thus, at E14.5, the level of apoptosis in Lig4Y288C embryos is greater than in WT embryos exposed to 100 mGy (as evident in Fig. 2C) [21]. ut stands for untreated. [These figures are based on original data presented in references 16, 21 and 22].

