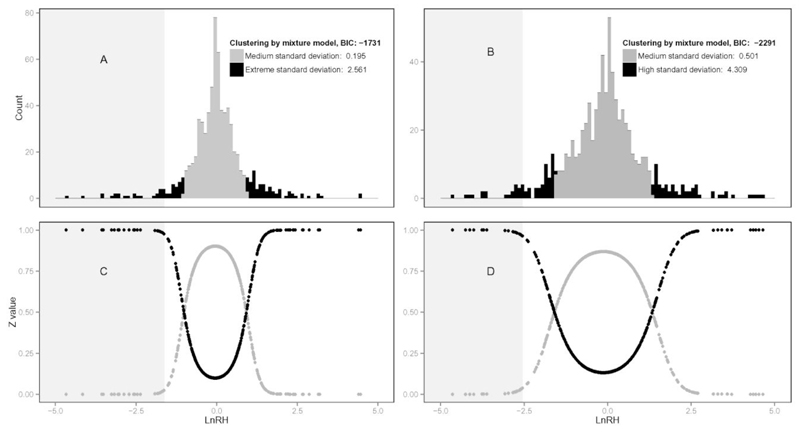
Figure 3. Clustering by mixture models of lnRH distributions.
A-C. ‘Contact’ versus ‘Close allopatry’ comparison. B-D. ‘Close allopatry’ versus ‘Distant allopatry’ comparison. For each comparison are presented (i) the lnRH distributions obtained by mixture models (top panels A and B), and (ii) the conditional probabilities of clustering for each marker (bottom panels C and D). Dark grey and black colours indicate the two underlying Gaussian distributions (dark grey: distribution with medium standard deviation, black: distribution with large standard deviation). The light grey shaded areas indicate the identified outlier loci from each global lnRH distribution. BIC: Bayesian information criterion.

