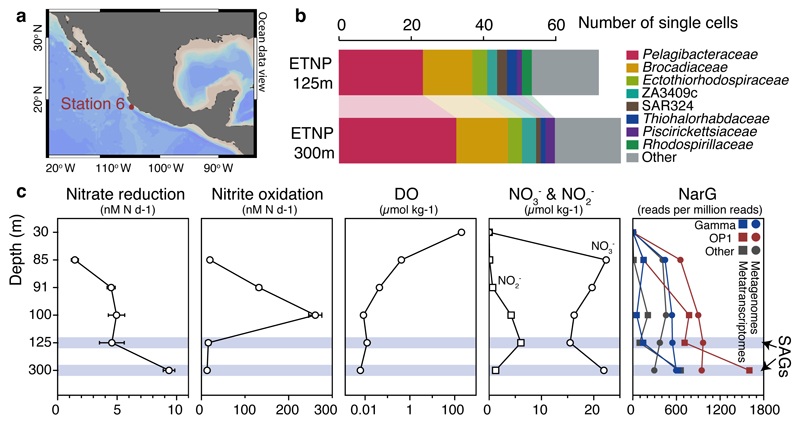
Figure 1. Site description and phylogenetic affiliation of single cells.
a, Location of station 6 (red) in the ETNP from which samples were obtained. Map was created with Ocean Data View (Schlitzer, R., odv.awi.de, 2015). b, Taxonomic classification of sorted single cells, based on their 16S rRNA genes. c, Nitrate reduction and nitrite oxidation rates relative to dissolved O2 (DO), nitrate, and nitrite concentrations and narG read abundance in metagenomes and metatranscriptomes. Error bars represent standard error from triplicate measurements. Note that a log10 scale is used for the DO plot and that 0.01 µmol kg-1 represents the detection limit of the STOX sensor oxygen data presented here. DO at 300 m was below the detection limit.

