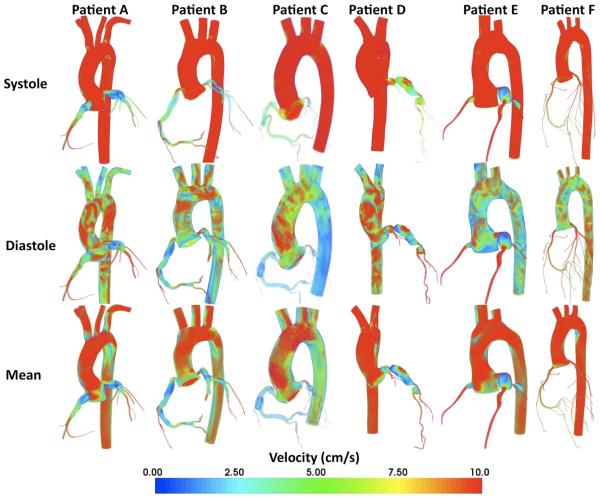
Fig. 2.
Volume-rendered velocity magnitude for all patients during systole (top), diastole (middle), and time averaged (lower). As shown in the simulation of the normal arterial tree, velocity was maximal during diastole (red). Sluggish or stagnant flow was demonstrated in many of the aneurysms (blue)

