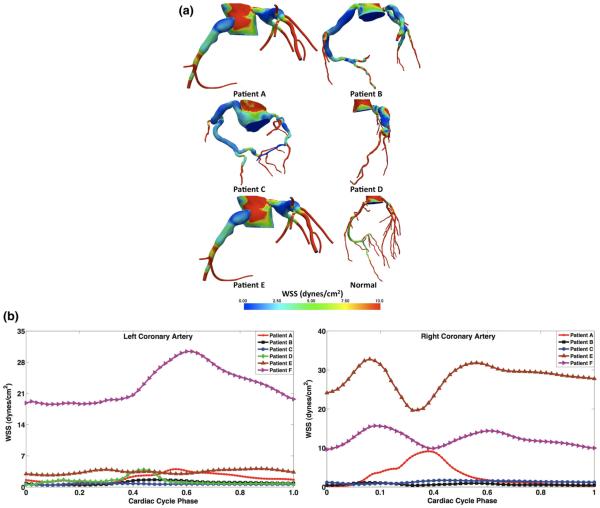
Fig. 3.
a Mean wall shear stress from simulation in all patient-specific models, showing lower values in aneurysmal regions, and large variation among patients. b Wall shear stress versus time in the LCA (left) and RCA (right) for one cardiac cycle in all models shows order of magnitude lower values in aneurysmal regions compared to normal

