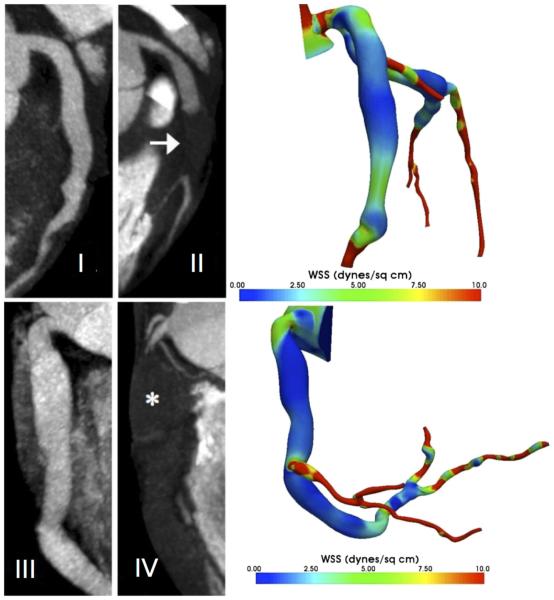
Fig. 6.
Left CT angiograms of the LAD (I, II) and RCA (III, IV) on a subject with a history of KD performed acutely (I, III) and 1 year after KD onset (II, IV), showing the interval development of thrombosis of the mid-LAD (arr ow, II) and nearly the entire RCA (ast er i sk, IV); Right simulation results for the same patient showing areas of lowest WSS in the corresponding regions of thrombosis

