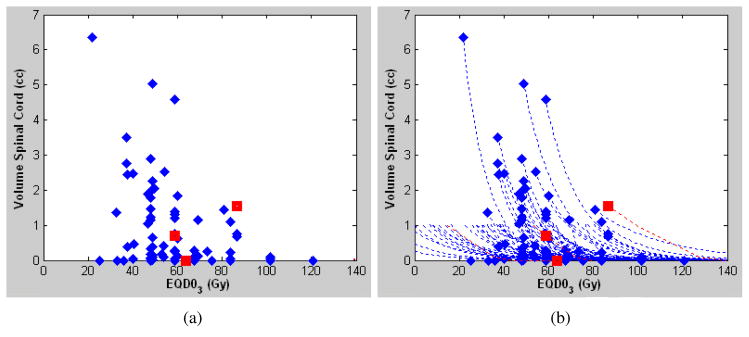
Figure 1.
Spinal cord dose-volume plot (a) from Gibbs et al. (2) and (b) with an approximated exponential DVH (dashed lines). The diamonds correspond to cases without complications and the squares correspond to cases with complications. Data points are the volume of spinal cord receiving 80% of the reference prescription dose or more.

