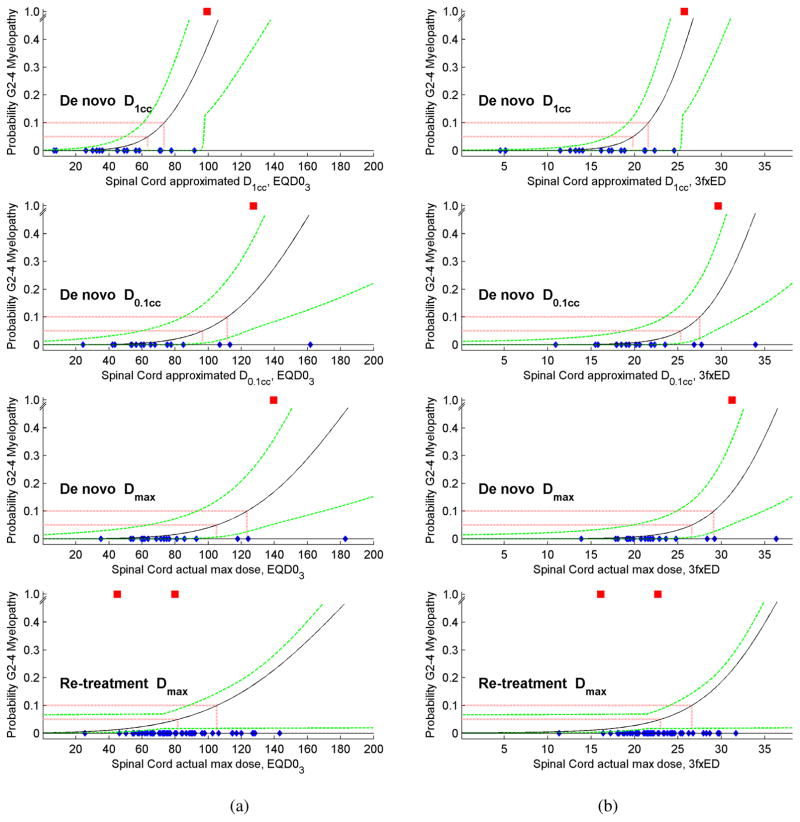
Figure 2.
The probability of Grade 2–4 Myelopathy was modeled (a) as it was computed in terms of EQD03, and (b) after conversion to 3-fraction equivalent doses (3fxED). For de novo cases the subplots are for D1cc, D0.1cc and Dmax, and for the re-treatment cases the subplot is for the SBRT Dmax only, without volumetric data. The myelopathy cases are plotted as red squares, the cases without complications are plotted as blue diamonds, the probit model is the solid black line, the 5% and 10% risk levels are plotted as red dashed lines, and the 68% confidence intervals are plotted as dashed green lines.

