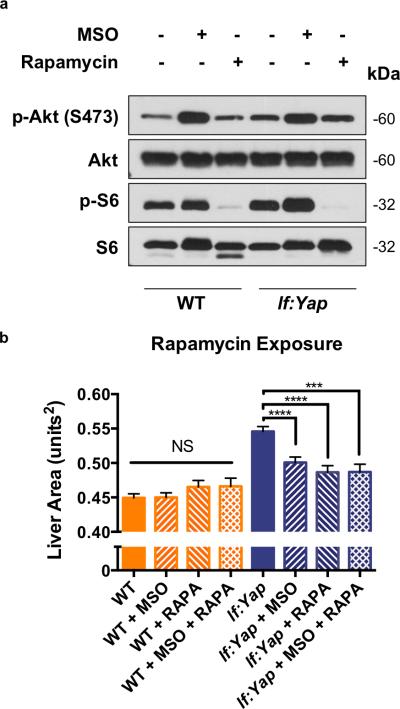
Figure 6. The mTOR pathway is not deregulated by Yap expression or GLUL inhibition, but it is required for Yap-induced hepatomegaly.
(a) Immunoblot analysis of phospho-Akt (p-Akt, S473), Akt, phospho-S6 (p-S6), and S6 levels in liver tissue isolated from adult WT and lf:Yap transgenic fish 24 hr after exposure to MSO or Rapamycin (RAPA). Immunoblots are representative of three independent experiments. Unprocessed original scans of blots are shown in Supplementary Fig. 8.
(b) Quantitative analysis of the effect of RAPA treatment from 3-5 dpf on liver size as determined by fluorescence microscopy. n=142, 148, 63, 40, 146, 130, 94 and 40 WT, WT+MSO, WT+RAPA, WT+MSO+RAPA, lf:Yap, lf:Yap+MSO, lf:Yap+RAPA and lf:Yap+MSO+RAPA larvae respectively; see Supplementary Table 4. ***p<0.001, ****p<0.0001, two-sided Student's t-test, values represent the mean±SEM.

