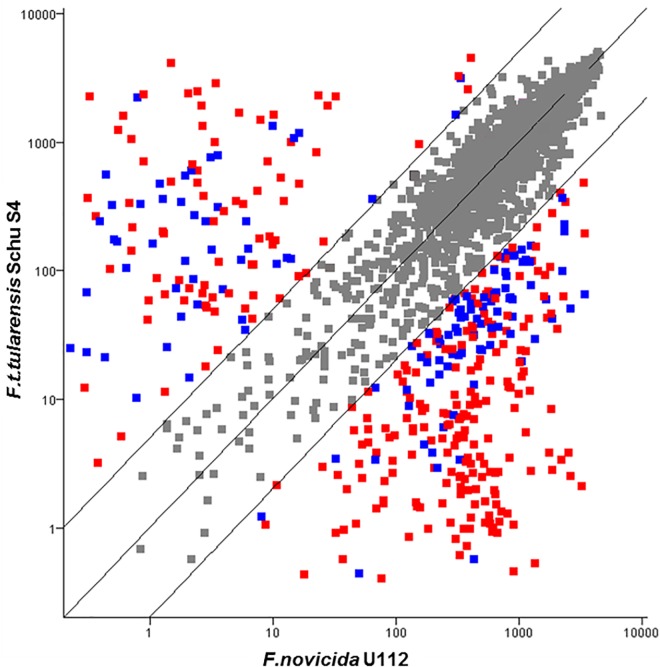
Fig 4. Comparison of Transcriptomes of Ftt Schu S4 and Fn U112.
Despite high genomic identity, Ftt and Fn have large scale transcriptional differences when grown under identical conditions. Each point represents a probe set monitoring the transcription of an ORF. The values on x and y axes represent the geometric mean of three biological replicates. Probe sets that have differential expression of less than five fold and/or a p-value greater than 0.05 in one way comparisons of Ftt Schu S4 with Fn U112 are colored grey. Of the remaining probe sets, those representing genes which are intact in both strains are colored red, while the probe sets representing genes with one of the orthologs annotated as a pseudogene are colored blue.].

