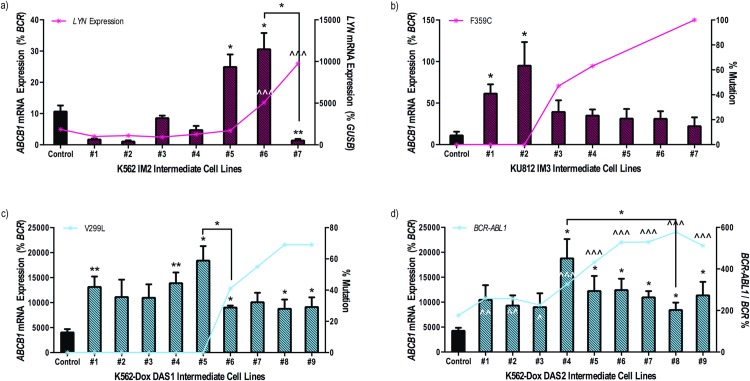
Fig 5. ABCB1 mRNA levels increase initially in imatinib and dasatinib resistant cell lines but decrease following emergence of additional resistance mechanisms.
Expression levels of ABCB1 mRNA were assessed in (a) K562, (b) KU812 and (c, d) K562-Dox cells resistant to (a, b) imatinib or (c, d) dasatinib. Expression levels were then correlated with other, previously defined, resistance mechanisms denoted by red and blue lines[15]. Specifically, (a) LYN mRNA expression, % of (b) imatinib resistant (F359C) and (c) dasatinib resistant (V299L) kinase domain mutations, (d) BCR-ABL1 mRNA expression. ABCB1 mRNA expression represents the mean of at least four independent experiments performed in triplicate. Statistical analyses compared mRNA levels (as a percentage of house keeping genes) in each resistant intermediate to corresponding control cells. Analyses were performed using unpaired Student’s t-test (Welch’s correction was applied for data groups with unequal SD) or Mann-Whitney Rank Sum test. Statistically significant p-values are denoted by carets (^) or asterisks (* p<0.05; ** p<0.01). Error bars represent SEM. IM = imatinib; DAS = dasatinib.

