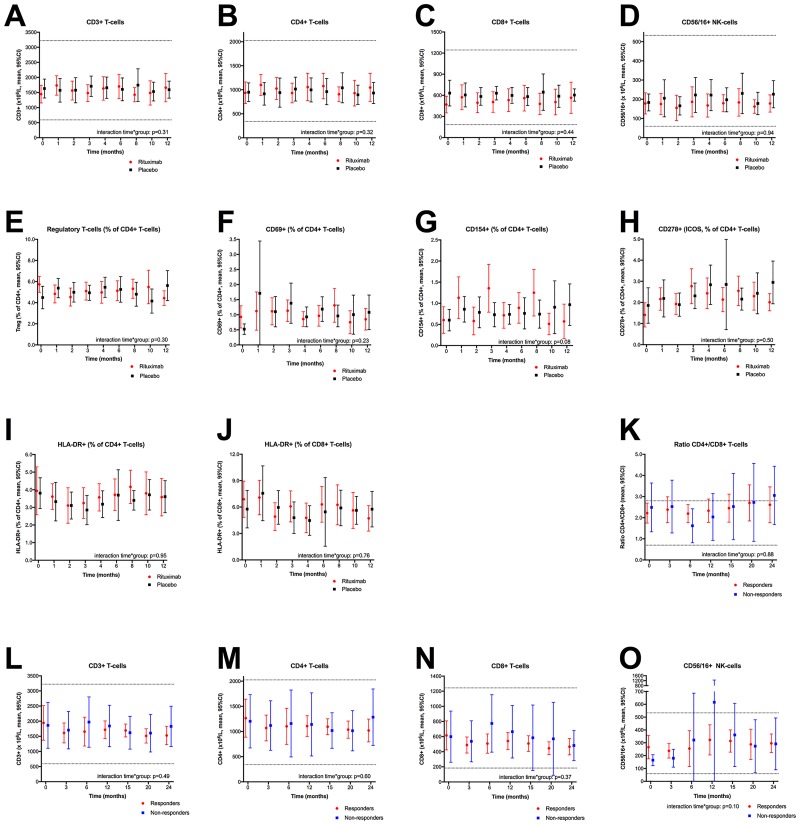
Fig 3. Lymphocyte subsets during follow-up in the KTS-1-2008 and KTS-2-2010 trials.
Panels A-D: Lymphocyte subsets among patients included in the randomized KTS-1-2008 study, in the rituximab group (red) and the placebo group (black), determined by flowcytometry and shown as million cells per liter at baseline (0 months), and at 1, 2, 3, 4, 6, 8, 10, and 12 months follow-up (n = 30). Panel A: CD3+ T-cells, panel B: CD4+ T helper cells, panel C: CD8+ cytotoxic T-cells, panel D: CD56+/16+ NK-cells. For 29 patients, data on lymphocyte populations were missing for 16 out of 261 (6.1%) time points. For General linear model (GLM) for repeated measures these were replaced by interpolation between preceding and succeeding values. The missing values were not replaced in the plots. Panels E-J: T-cell activation markers among patients included in the KTS-1-2008 trial, at baseline and through 12-months follow-up, and shown as percentage of the CD4+ T helper cell population, as determined by flowcytometry. Panel E: Regulatory T-cells, panel F: CD69+ cells, panel G: CD154+ cells, panel H: CD278+ (ICOS) cells, panel I: HLA-DR+ cells. Panel J shows the percentage of HLA-DR+ cells among the CD8+ cytotoxic T-cells. For 29 patients, data on T-regulatory cells and T-cell activation parameters were missing for 30 out of 261 (11.5%) time points. For GLM, missing values were replaced by interpolation between the preceding and succeeding analyses (not replaced in the plots). Panels K-O: Lymphocyte subsets among patients in the KTS-2-2010 study receiving rituximab maintenance therapy, determined by flowcytometry and shown as million cells per liter at baseline (0 months), and 3, 6, 12, 15, 20, and 24-months follow-up. Responders to B-cell depletion therapy are shown in red and non-responders in blue. Panel K: Ratio of CD4+/CD8+ T-cells, panel L: CD3+T- cells, panel M: CD4+ T helper cells, panel N: CD8+ cytotoxic T-cells, panel O: CD56/16+ NK-cells. In three patients, data on lymphocyte subpopulations for at least three time points were missing, these three were omitted leaving 23 patients for GLM analyses to assess the interaction between time and response group. In these 23 patients, 15/161 (9.3%) data were missing; these were replaced by interpolation between preceding and succeeding values (not replaced in the plots). Analyses for interaction between time and intervention group, i.e. assessing for difference in course of the variables over time, between the rituximab and placebo groups (panels A-J), or between responders and nonresponders to rituximab maintenance treatment (panels K-O), were performed using GLM for repeated measures. Error bars denote 95% confidence intervals (CI) for the mean values. The dotted lines indicate lower and upper normal reference values as established at Haukeland University Hospital.

