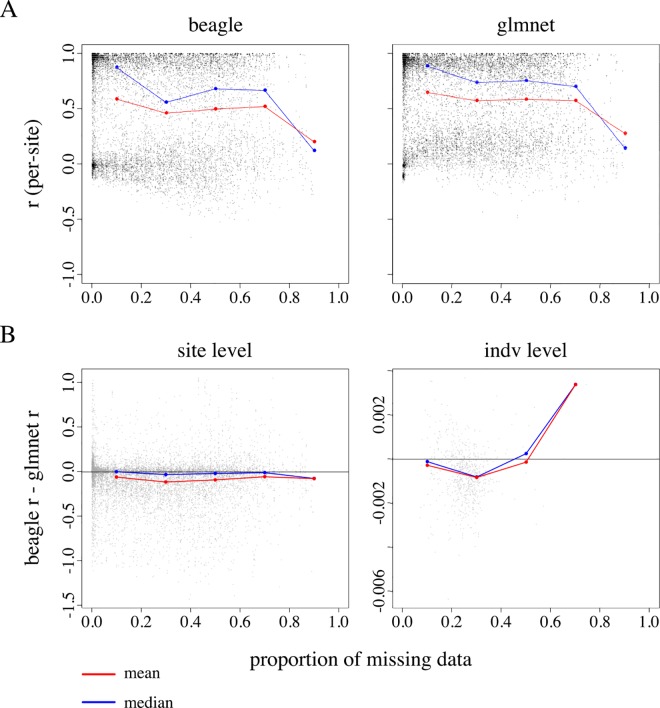
Fig 3. Per-site and per-individual imputation accuracy as a function of missing data and median read depth.
(A) Beagle and glmnet imputation accuracy as a function of missing data for sites in set C (n = 9737). (B) The x- and y-axis display the proportion of missing data and the accuracy difference between Beagle and glmnet at the site and individual level. The range of x is divided into ten-equally sized bins (i.e. 0.00 < x ≤ 0.10, 0.10 < x ≤ 0.20, …, 0.90 < x ≤ 1.00), and accuracy differences are divided into bins according to levels of missing data. Bin means and medians, summarizing the data within each bin, are displayed as red and blue points, respectively. Points falling on the black vertical line at y = 0 indicate no observed accuracy difference between Beagle and glmnet imputation. Points falling below y = 0 represent cases where glmnet imputes with higher accuracy relative to Beagle.

