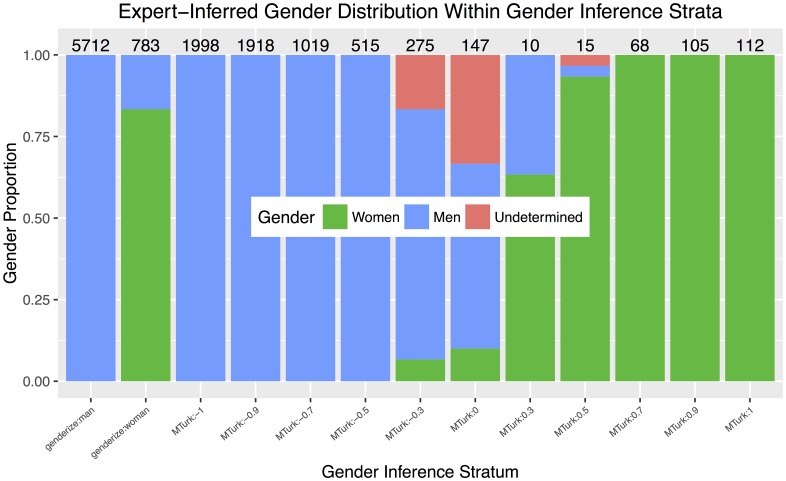
Fig 3. Distribution of expert-inferred genders for each stratum in gender calibration procedure.
Each bar shows the distribution of 30 expert gender inferences. The 30 editorships comprising each bar are sampled randomly from the appropriate stratum of our data set. The two left bars show the distribution of expert-inferred genders for editorships processed through the genderize.io gender inference tool. The eleven rightmost bars show the distribution of expert-inferred genders for different levels of gender score compiled from our Amazon Mechanical Turk (MTurk) data. The number in each stratum label along the horizontal axis refers to the midpoint of the gender score interval. For instance, MTurk:-1 corresponds to editorships inferred by all five Turkers to be men, while MTurk:0.7 corresponds to editorships with MTurk gender scores in the interval [0.6, 0.8), likely women; see text for further explanation. The number on top of each bar gives the number of unvalidated editorships, that is, the number of editorships in our full data set falling within the stratum, excluding the 30 that were randomly sampled.

