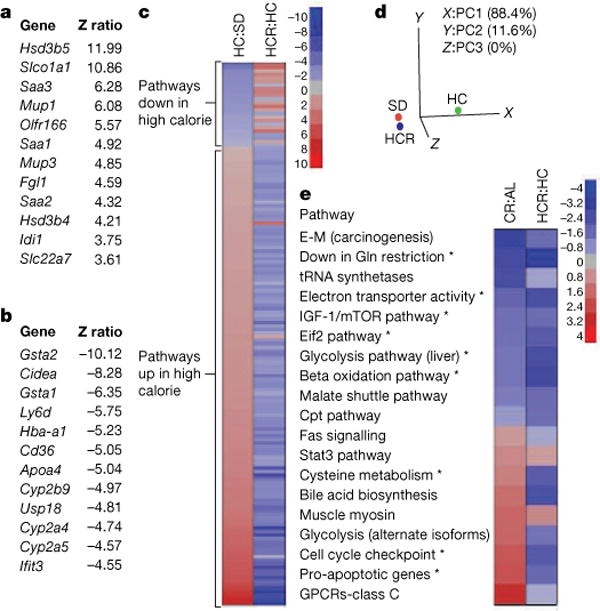
Figure 4. Resveratrol shifts expression patterns of mice on a high-calorie diet towards those on a standard diet.

a, b, The most highly significant upregulated (a) and downregulated (b) genes in livers of HC and HCR groups are shown. c, Parametric analysis of gene-set enrichment (PAGE) comparing every pathway significantly upregulated (red) or downregulated (blue) by either the HC diet or resveratrol (153 in total, with 144 showing opposing effects). d, Principal component analysis of PAGE data. The first principal component (PC1) is dominant, with 88.4% variability, and shows HCR to be more similar to SD than HC. e, Comparison of pathways significantly altered by resveratrol treatment and caloric restriction using data from the AGEMAP caloric restriction study. Pathways with significant differences between HC and HCR are indicated by an asterisk. Complete pathway listings are in Supplementary Fig. 7. Asterisk, P < 0.05 versus HC. n = 5 for SD and HC; n = 4 for HCR.
